In some cases, Logging Data to Excel from Arduino become necessary for data analysis especially when a graphical analysis of multiple data is necessary. At the same time, we can use Arduino or any kind of device that is sending data to a PC, we can log them. Let’s see how.
⚠️Disclaimer:
Working with electricity involves serious risk. Ensure you have the necessary skills and take proper safety precautions before attempting any electrical projects. Proceed at your own risk — the author assumes no responsibility for any damage, injury, or issues resulting from the use or misuse of the information provided.
All content on this website is original and protected by copyright. Please do not copy or reproduce content without permission. While most of the resources shared here are open-source and freely accessible for your learning and benefit, your respect for our intellectual effort is appreciated.
If you find our tutorials helpful, consider supporting us by purchasing related materials or sharing our work — it helps keep the content flowing.
Need help or have questions? Leave a comment below — the author is always happy to assist!
Table of Contents
Step#1: Setup your device
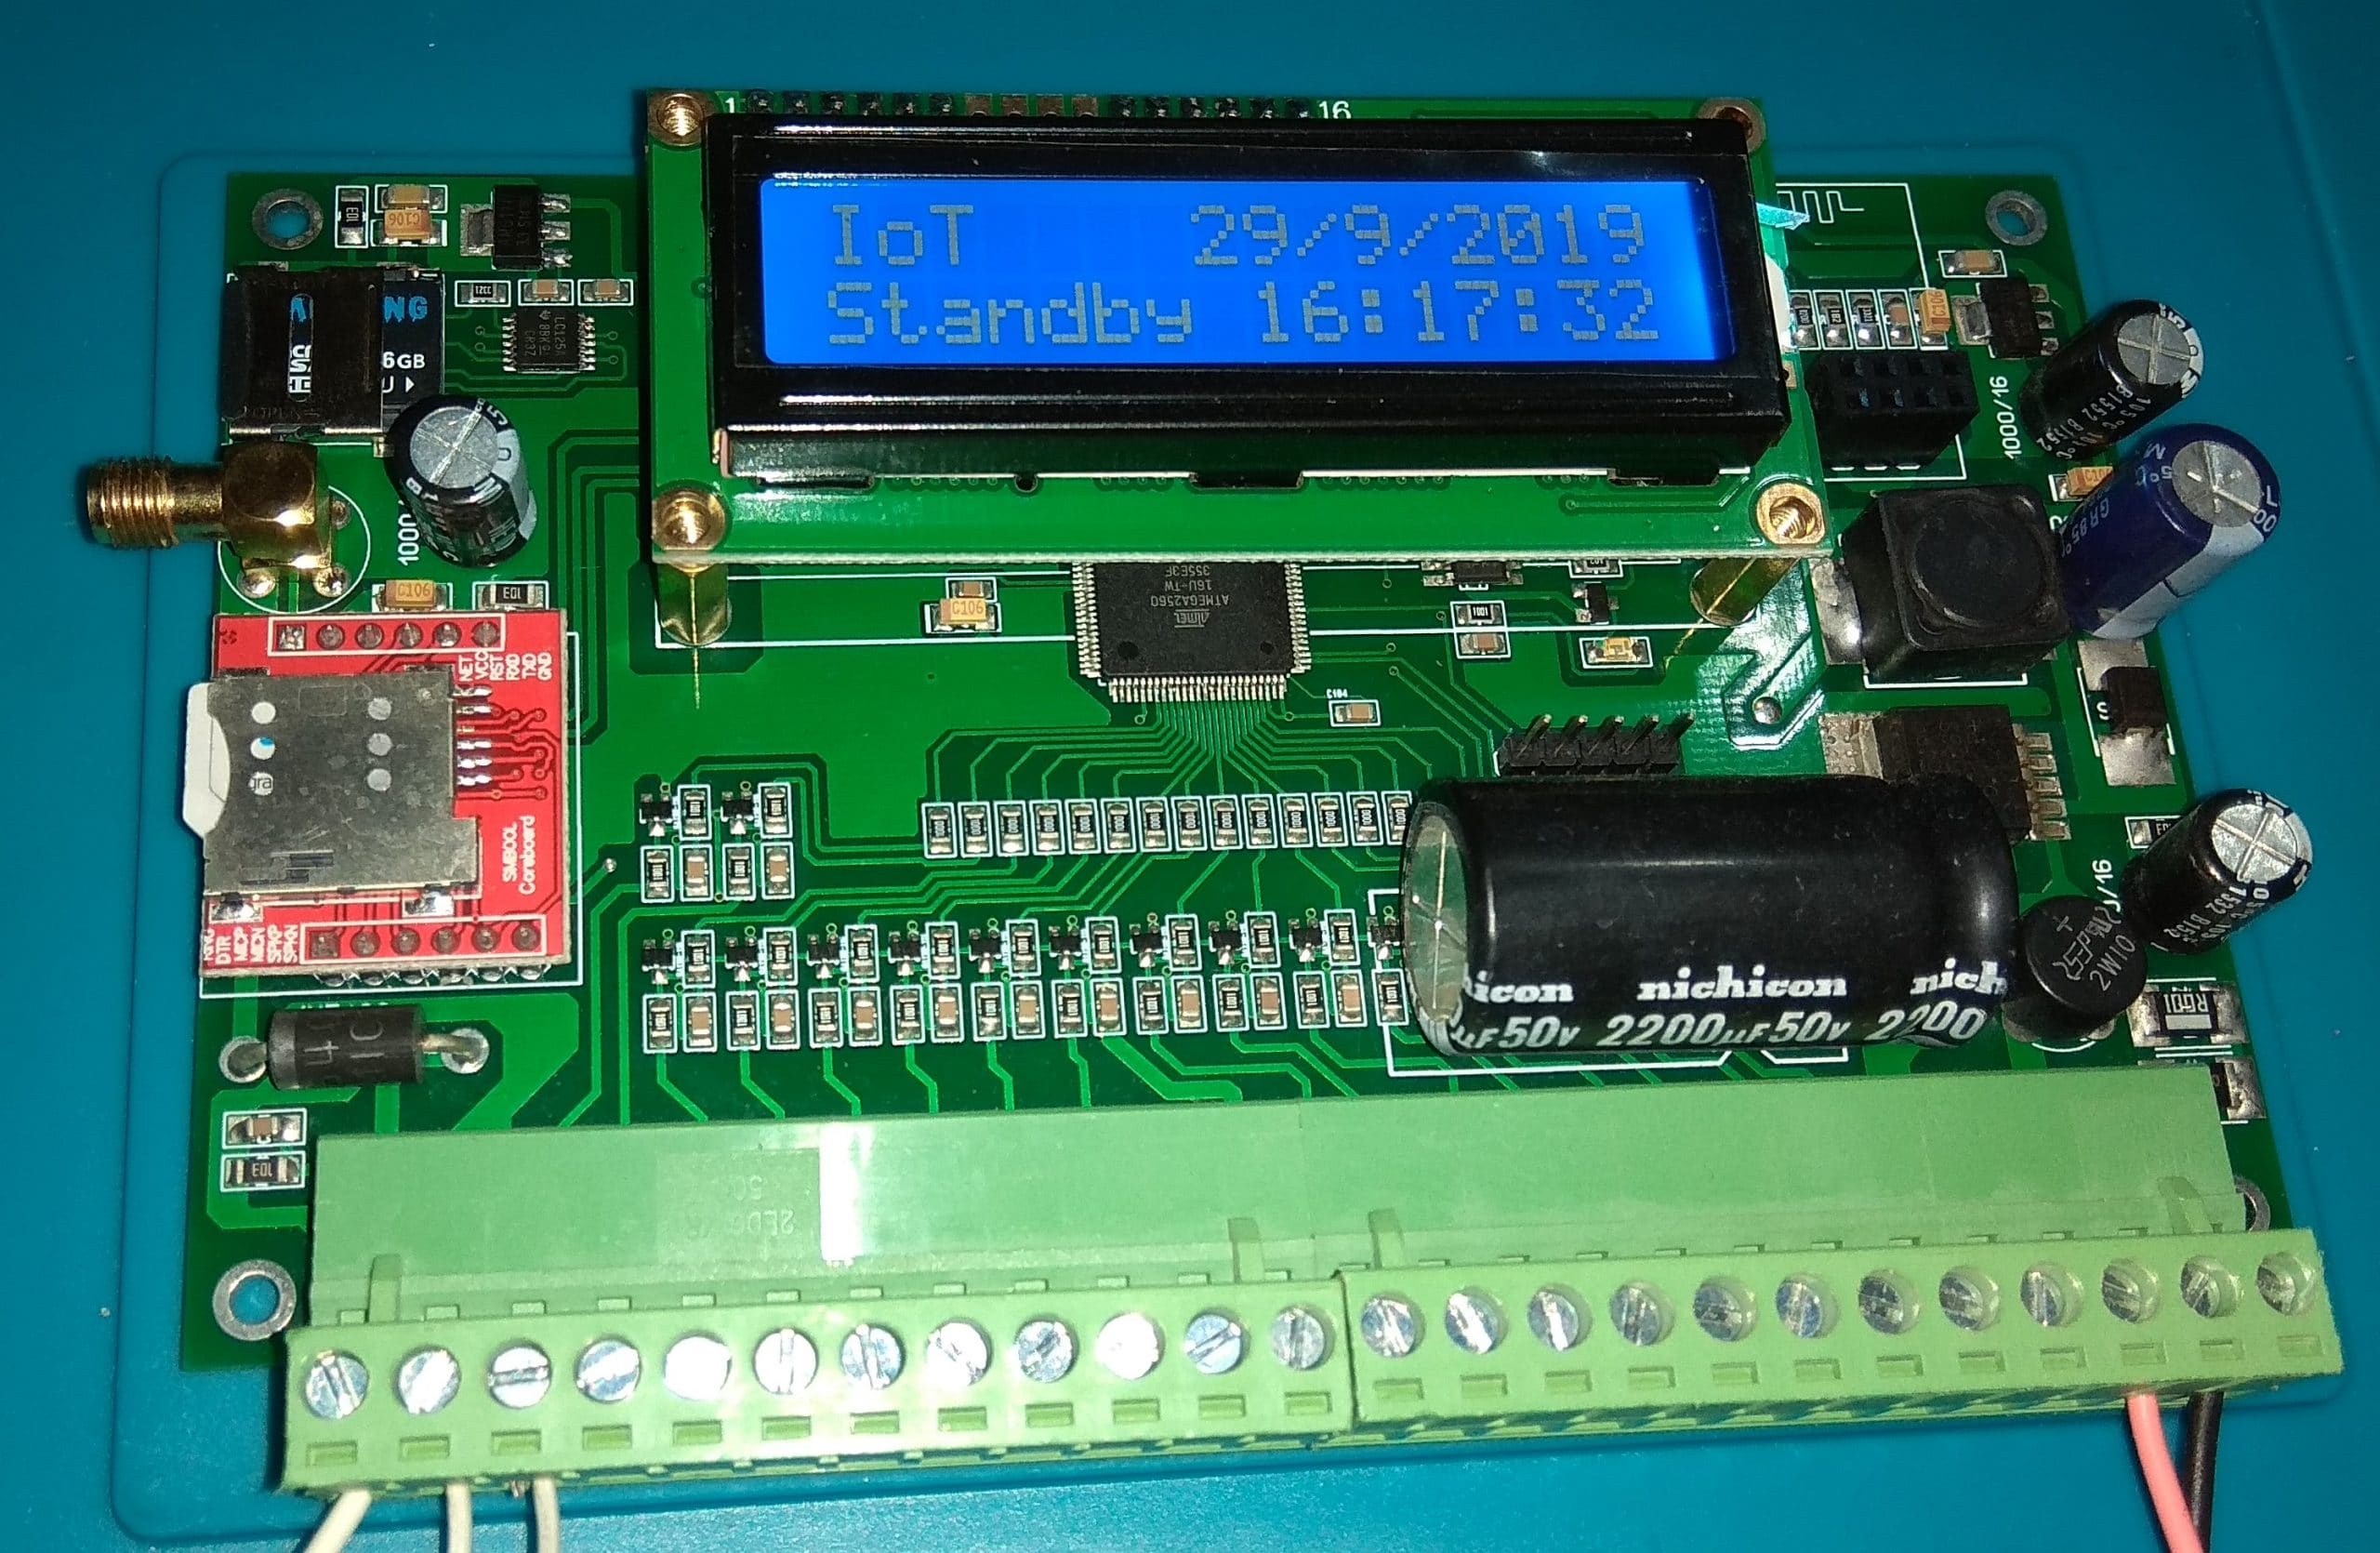
First, set up your device with a USB or Serial cable so that the device can send data to the PC. If you use Arduino, then connect your Arduino and open the serial terminal to ensure data is coming. Then ensure data rate I mean baud rate. Say 9600 or 115200 or so…
Step#2: Setup your Excel
Microsoft Excel has a feature named Data Streamer. Download it and install it. After installation, you have an option on the top of your Excel file.
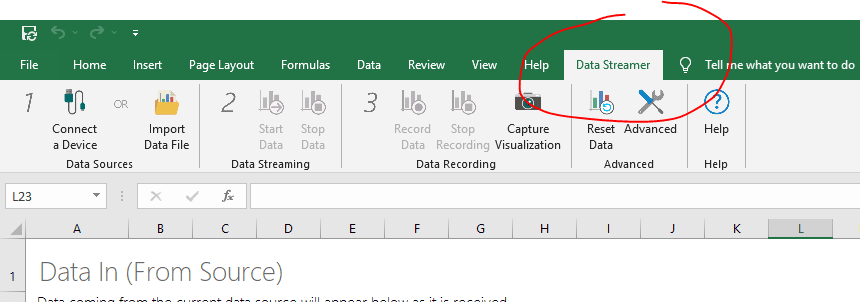
On the top-left corner, you have an option to ‘Connect a Device‘. Connect your device to your PC and click this option.
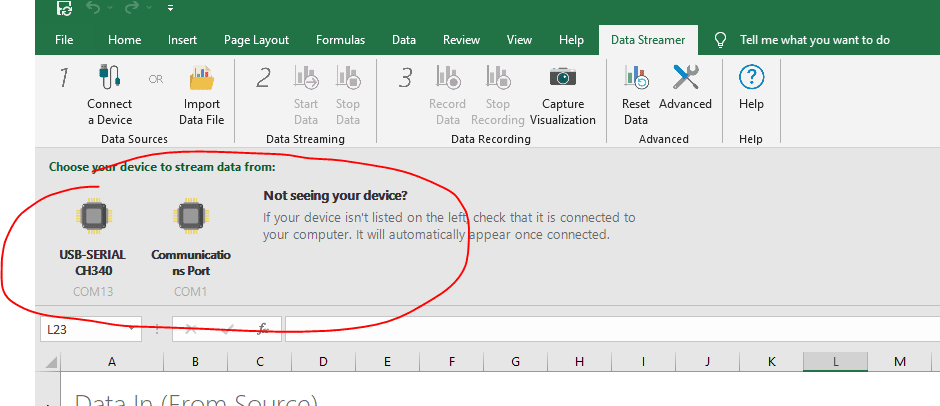
Now, you have the option and select your device from the list. And then click on Start Data.
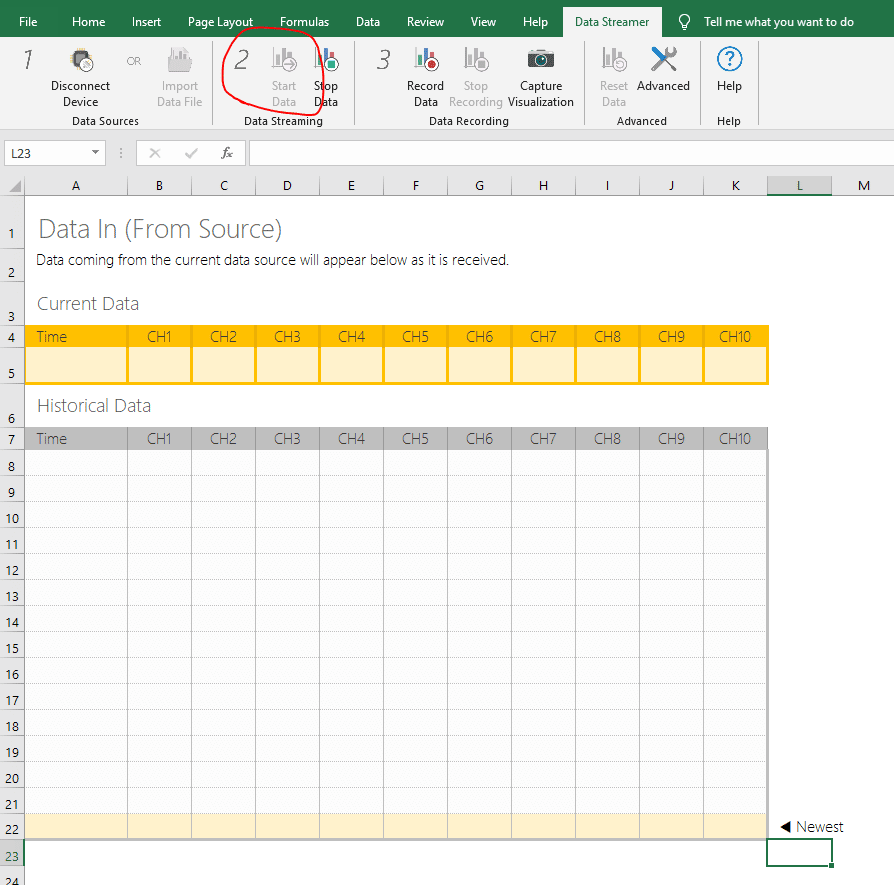
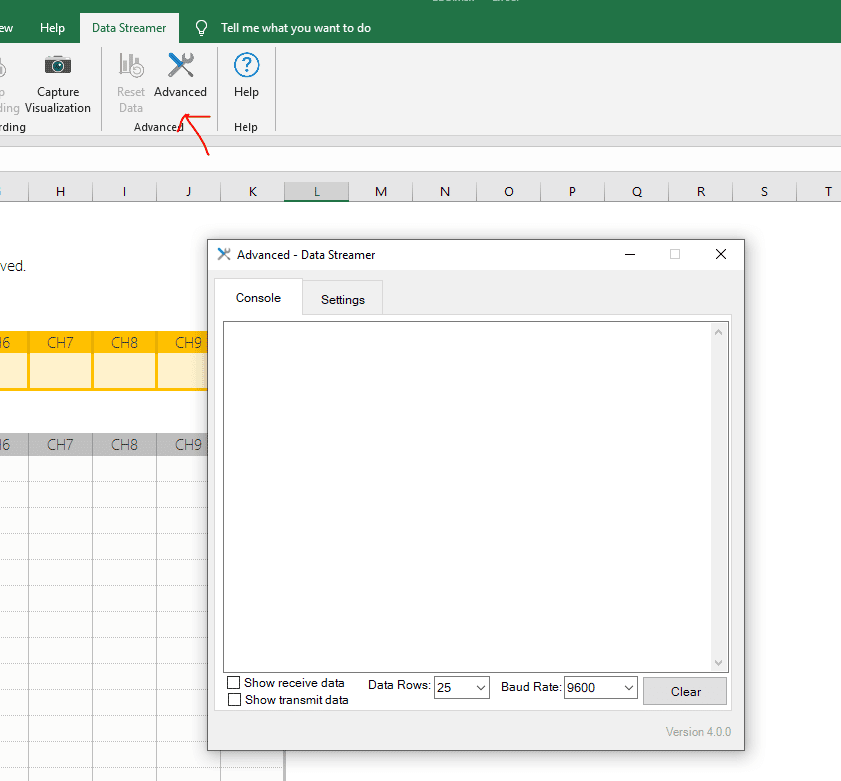
This will start the data to show, but it won’t record yet. Now, you have to click on ‘Record Data‘ to log your data. But, in some cases, if your data is not coming according to the default settings of Excel, then it won’t show anything. The default baud rate of Excel is 9600. If your data is coming in a different baud rate, then click on ‘Advance‘.
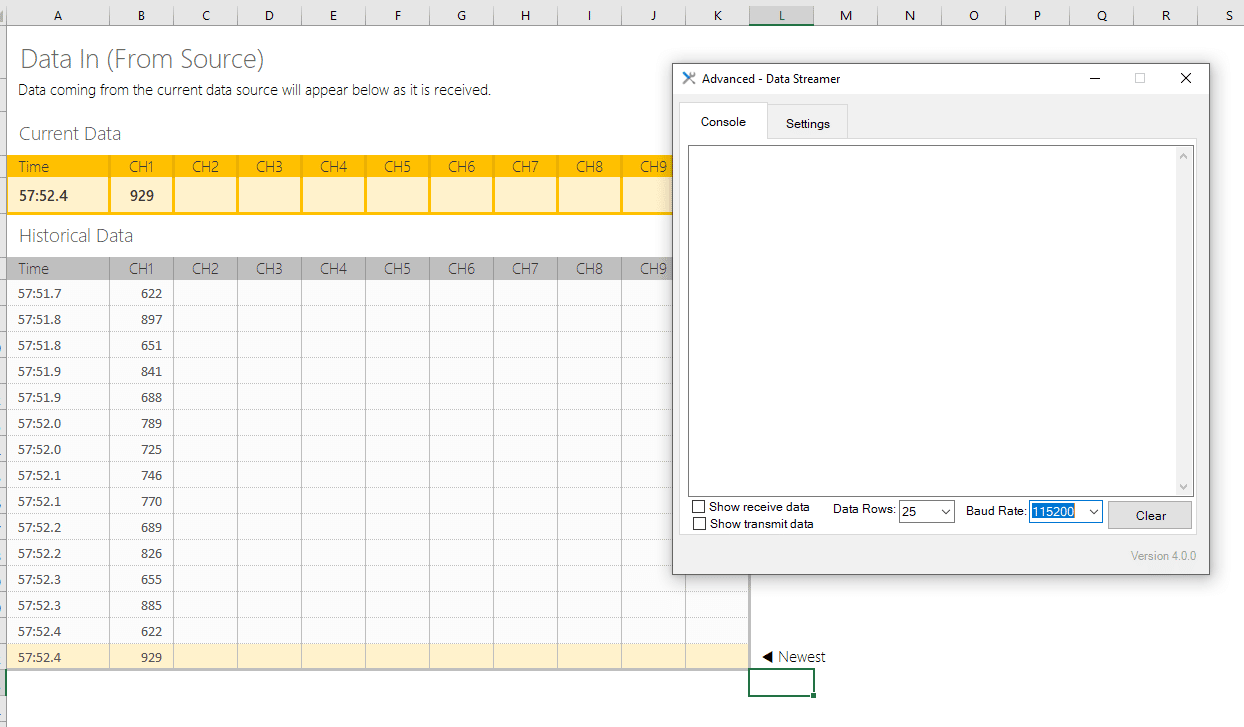
Now, you have an option to set up the Baud Rate. Select yours and select Data Rows.
Once I select my one, then it starts recording the data instantly.
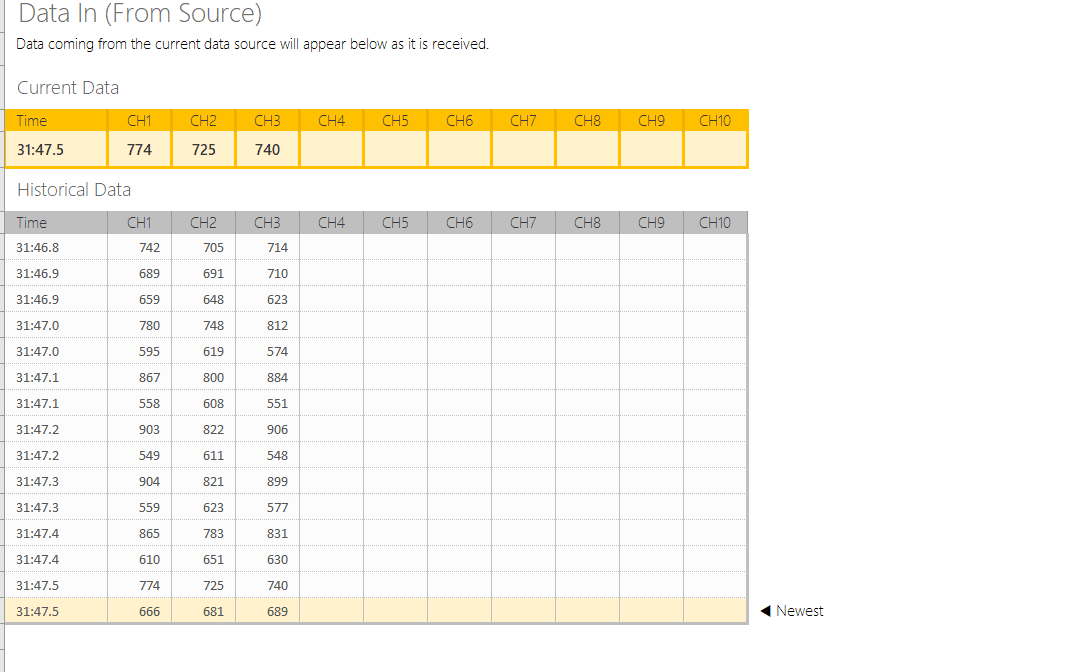
Note: For multiple channels, simply keep a coma (,) between the channel data like this:
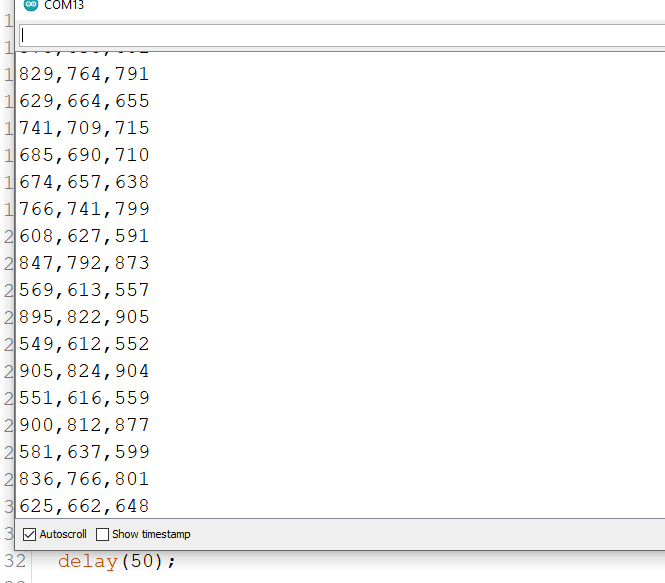
And you’ll get the result in Excel like this:
Step#3: Save and create the graph
Now, run the device and record the data according to your requirement. Once data is recorded, simply click ‘Stop Recording‘ which will stop recording and allow you to save a copy.
now you can create graphs from your data.
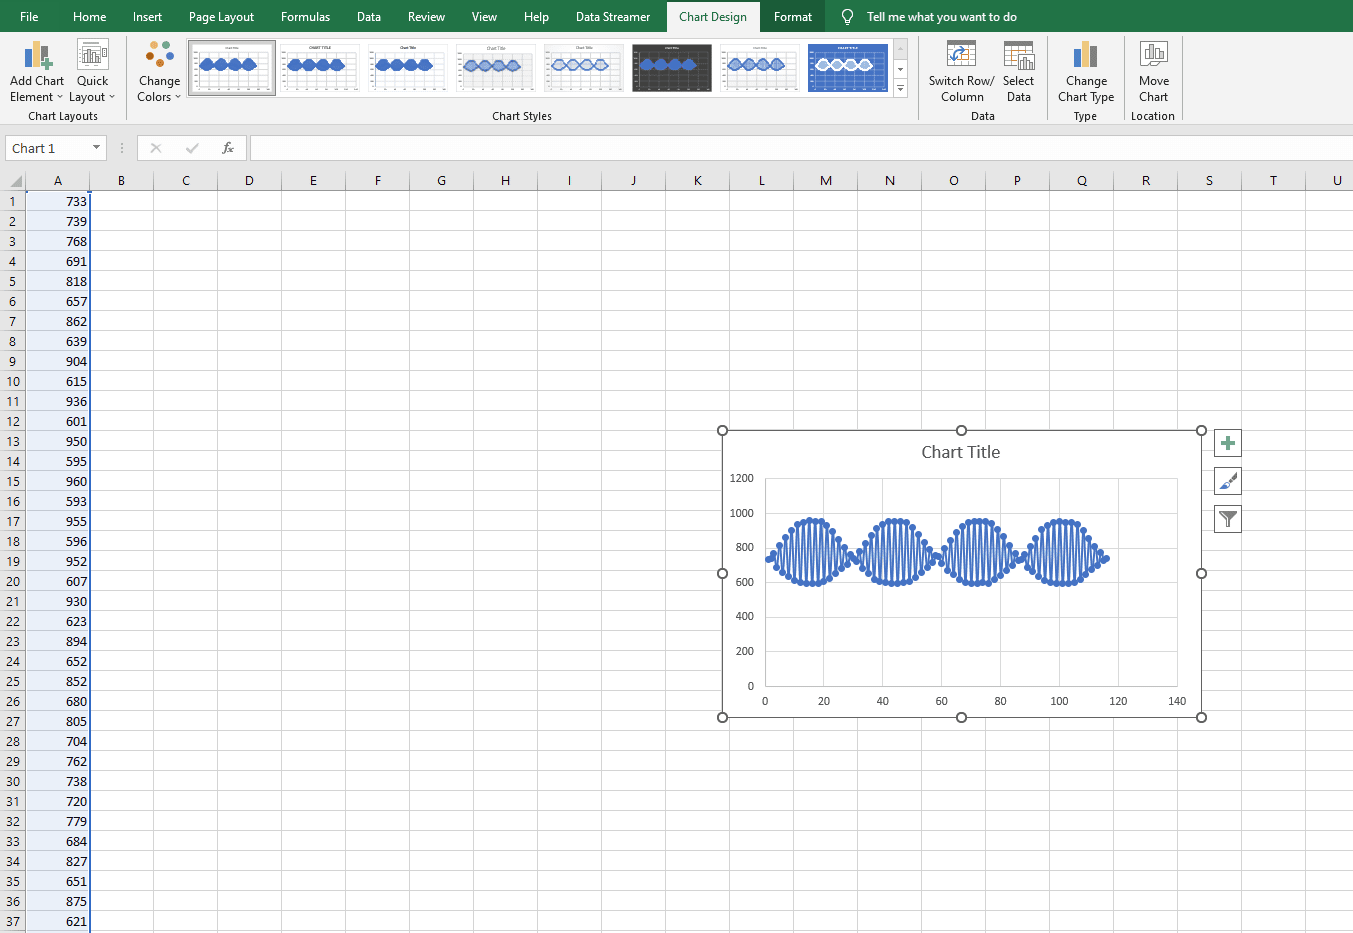
Now, you can do whatever you need, even with multiple channel data.
End
I think, now you can log your data to an external file and create graphs easily. Thanks, Microsoft for the add-on. And now, we are able to explore more. Hope this helped you.
You can also check some other articles:
- STM32 as USB Device
- Connect to Raspberry Pi from your Laptop/Desktop using VNC Viewer
- Save String in the EEPROM
- Interfacing External EEPROM with PIC microcontroller
- Not Enough ROM/RAM error with micro-controllers
- Interfacing multiple external EEPROM with Arduino through I2C
Thank you.
Liked this article? Subscribe to our newsletter:
or,
Visit LabProjectsBD.com for more inspiring projects and tutorials.
Thank you!


0 Comments